 |
|
||||||||
 |
||||||||



A Look Into the Markets |

Mortgage rates pulled back from one-year highs this week after markets responded favorably to comments from Fed Chairman, Kevin Warsh and a pair of encouraging inflation reports. The combination gave bonds a much-needed boost and reminded investors that inflation, not politics, remains the primary driver of interest rates. Let's break it down. “Don't you feel it growing, day by day? People getting ready for the news. Some are happy, some are sad. Oh, we've got to let the music play.” - Listen to the Music by The Doobie Brothers. Warsh on the Hill Kevin Warsh's semiannual testimony on Capitol Hill captured the market's attention. While his comments covered a wide range of economic topics, one message stood out: the Federal Reserve cannot afford to become complacent on inflation. Warsh emphasized that the Fed's credibility depends on maintaining price stability and made it clear that persistent inflation is something policymakers simply cannot tolerate. Markets interpreted his remarks as reinforcing the Fed's commitment to keeping inflation under control while remaining flexible should inflation continue to cool. That helped improve investor confidence in the bond market, pushing bond prices higher and mortgage rates lower from the week's highs. Although one speech doesn't change monetary policy, markets often react to influential voices when they reinforce the broader narrative. This week, that narrative favored bonds. Deflation Helps Bonds The week's biggest economic news came from the June Consumer Price Index (CPI) and Producer Price Index (PPI). Both reports showed outright monthly price declines, the first broad-based monthly deflation readings since 2020. For the bond market, that's welcome news. Lower inflation reduces pressure on the Federal Reserve to keep interest rates elevated for an extended period. If inflation continues trending lower, policymakers gain greater confidence that price pressures are moving back toward their long-term target. That opens the door to future rate cuts and generally supports lower long-term interest rates, including mortgage rates. While one month doesn't establish a trend, this week's reports were certainly a step in the right direction. Oil Spikes Not all the news was positive. Escalating tensions surrounding the U.S. and Iran sent crude oil prices briefly toward the $80-per-barrel level. Energy prices remain one of the quickest ways inflation can reaccelerate because higher fuel costs ripple through transportation, manufacturing, and consumer prices. If oil remains at or above these levels for an extended period, it could begin showing up in future inflation reports and potentially offset some of this week's encouraging data. It's something the bond market and the Federal Reserve will be watching closely. 30-Year Mortgage Rates and 10-Year Note 30-Year Fixed Mortgage Rate (Freddie Mac daily average, July 16, 2026)
10-Year Treasury Note Yield (daily close, July 16, 2026)
Looking Ahead The economic calendar is relatively quiet next week, with New Home Sales and Weekly Initial Jobless Claims being released. We'll also enter the Federal Reserve's blackout (or quiet) period ahead of the next FOMC meeting. During this time, Fed officials refrain from making public comments about monetary policy, interest rates, or the economic outlook. For now, inflation continues moving in the right direction, bonds have responded favorably, and mortgage rates have improved from their recent highs. The question is whether that momentum can continue. |
Mortgage Market Guide Candlestick Chart |
|
Each candle represents one day of trading. As mortgage bonds prices move higher, rates move lower. You can see on the right side of the chart, how mortgage bond prices improved over from the worst prices (and rates) of the year. Chart: Fannie Mae 30-Year 5.5% Coupon (Friday, July 17, 2026)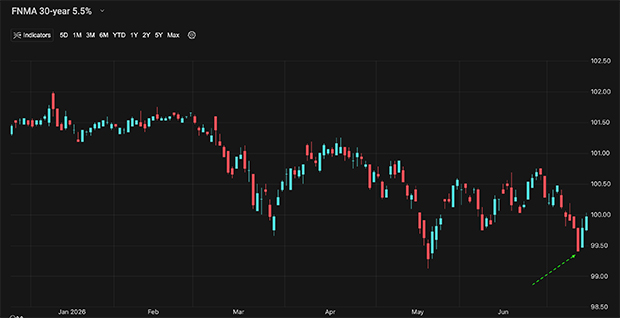 Economic Calendar for the Week of July 20 - 24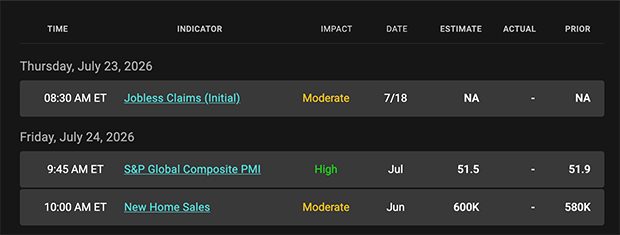 |
